Analyzing the Computation Run
In this tutorial you will learn how to get detailed information about the calculation process while creating an image. Internally, DeepDrill records the outcome of the computation in a so called drill map. This map does not only contain the derives color values. It also keeps track of the various optimizations that have been applied during the computation run. Examples are the number of skipped iterations by applying series approximation or the number of skipped pixels due a positive area check.
Running the map analyzer
To gather statistical information, you can advise DeepDrill to run a map analyzer at the end of the computation. The map analyzer is run automatically when the -v option is specified at the command line. This flag tells DeepDrill to produce verbose output after completing each computatation stage.
./deepdrill -v top.ini -o top.map

DeepCDrill 3.1 - (C)opyright Dirk W. Hoffmann

                        Center: -0.700000 + 0.000000i (128 bit)
                    Upper left: -2.791503 - 1.176471i (128 bit)
                   Lower right:  1.389325 + 1.174292i (128 bit)
                 Magnification: 0.85b1
                   Drill depth: 1000
                 Escape radius: 1e+32

                      Map size: 1920 x 1080 (3D)
                    Image size: 1920 x 1080 (2D)

                  Perturbation: yes
          Series approximation: yes
                 Area checking: yes
               Period checking: yes
            Attractor checking: yes

        Running the area check: ................................. 1.11 sec

Round 1 / 50: 1784039 points remaining

     Computing reference orbit: ................................. 0.00 sec

               Reference point: (960,540)
        Perturbation tolerance: 1e-06
                 Maximum depth: 1000
                  Actual depth: 1000

        Computing coefficients: ................................. 0.00 sec

                  Coefficients: 5
       Approximation tolerance: 1e-12

         Checking probe points: ................................. 0.00 sec

          Skippable iterations: 0

        Computing delta orbits: ................................. 1.48 sec

                      Glitches: 0

All rounds completed: 0 unresolved

            Preparing map file: ................................. 0.05 sec

                      Map size: 1920 x 1080
                 Drill results: Saved
              Iteration counts: Saved
           Skipped interations: Saved
   Normalized iteration counts: Saved
                   Derivatives: Not saved
                       Normals: Saved

          Compressing map file: ................................. 0.62 sec

                Size reduction: 22848105 Bytes (64%)

               Saving map file: ................................. 0.00 sec
           Analyzing drill map: ................................. 0.00 sec

           Drill locations:

                         Total:   2073600 (100.00 %)
                   Unprocessed:         0 (  0.00 %)
                      Interior:    318431 ( 15.36 %)
                      Exterior:   1755169 ( 84.64 %)
                      Glitches:         0 (  0.00 %)

           Locations with applied optimizations:

                         Total:    308758 ( 14.89 %)
              Main bulb filter:    248206 ( 11.97 %)
               Cartioid filter:     41354 (  1.99 %)
          Series approximation:         0 (  0.00 %)
              Period detection:      1250 (  0.60 %)
           Attractor detection:     17948 (  0.87 %)

           Iteration counts:

                         Total: 336029916 (100.00 %)
                      Interior: 318431000 ( 94.76 %)
                      Exterior:  17598916 (  5.24 %)

           Skipped iterations:

                         Total: 301036579 ( 89.59 %)
              Main bulb filter: 248206000 ( 73.86 %)
               Cartioid filter:  41354000 ( 12.31 %)
          Series approximation:         0 (  0.00 %)
              Period detection:     91412 (  0.30 %)
           Attractor detection:  11385167 (  3.39 %)

Total time: 3.34 sec
You’ll find the outcome of the map analyzer at the very end of the output.
Highlighting pixels
To enable additional debug options, pass in profile debug.ini. This file contains the following definitions:
[perturbation]
color = red
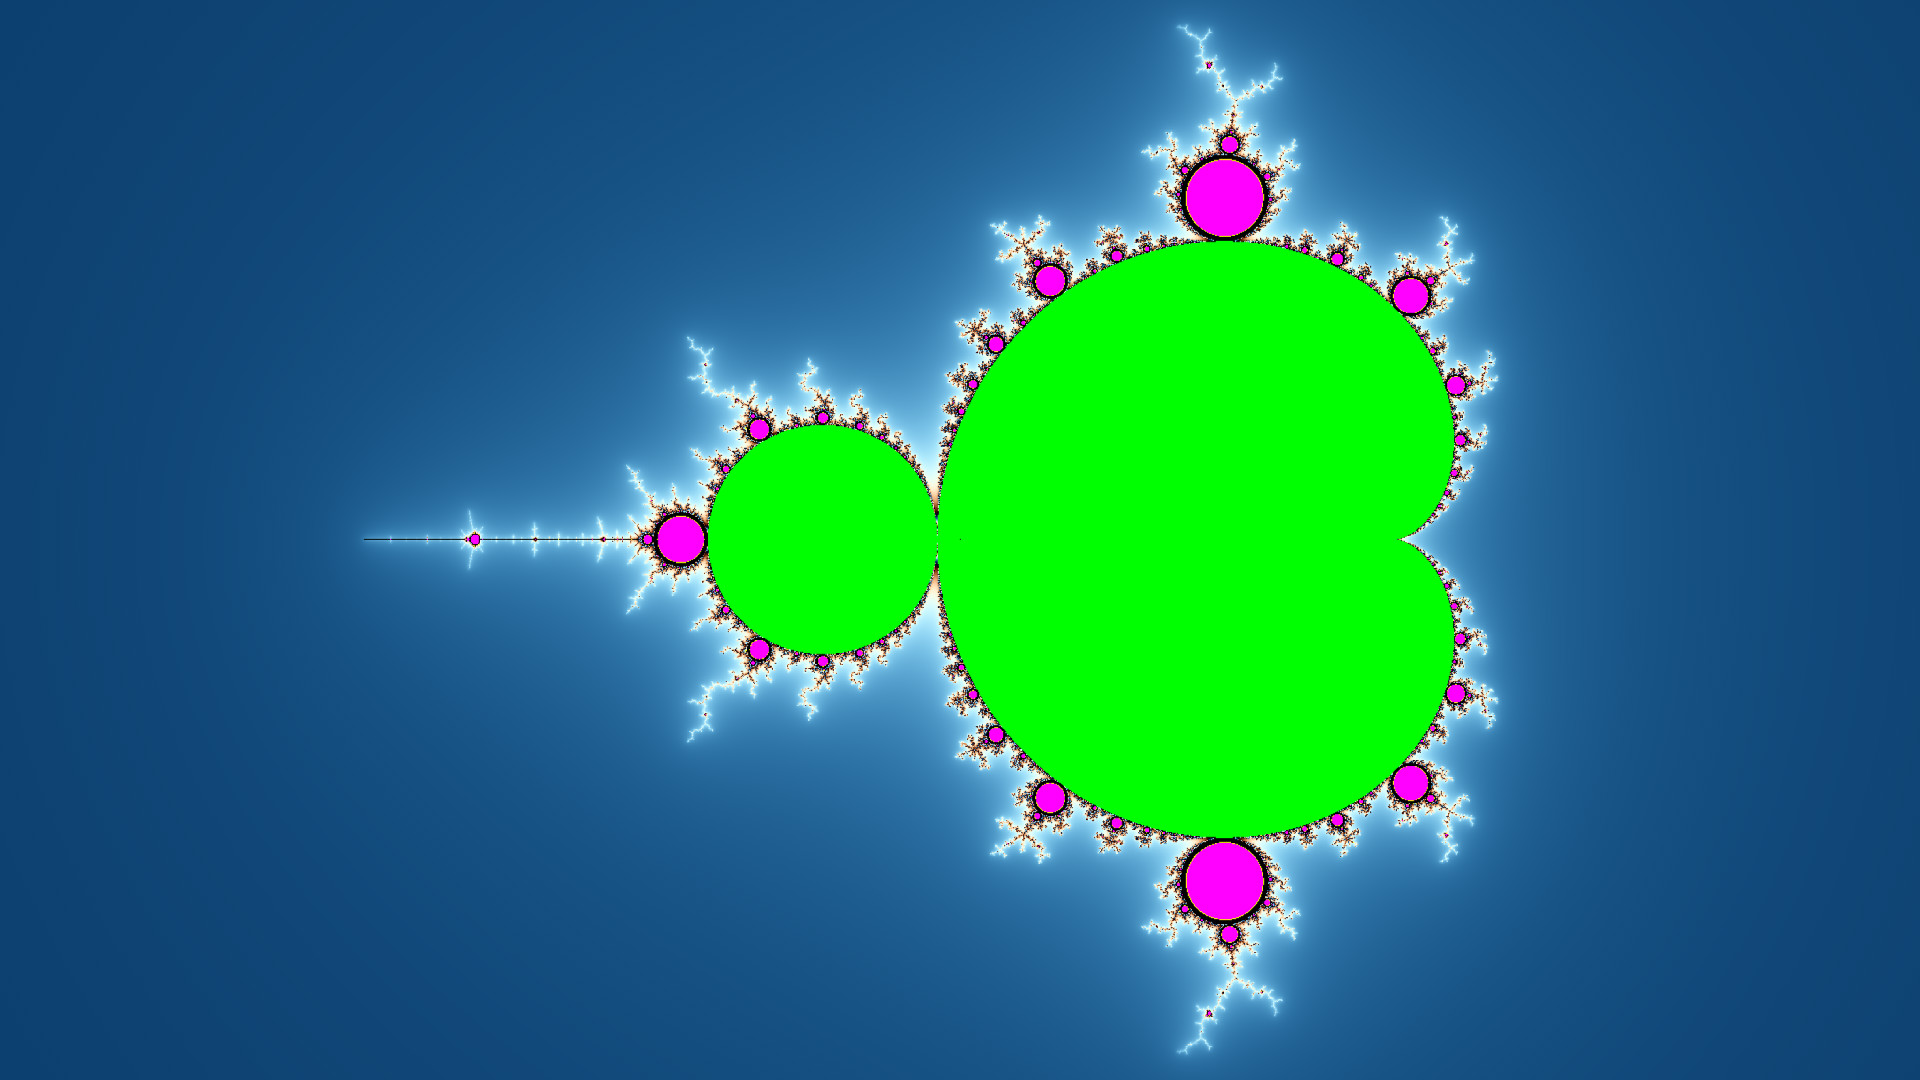
[areacheck]
color = green
[attractorcheck]
color = magenta
[periodcheck]
color = yellow
The color key in the perturbation section tells DeepDrill to draw all glitch points in red. Glitch points are points for which it is still unclear whether they belong to the Mandelbrot set or not. By default, these points are colored black. See the Theory section to learn more about perturbation theory and glitch point detection.
The next three keys instruct DeepDrill to mark pixels for which the area checker, the attractor checker or the period checker has signaled a hit. All three checkers are used to speed up calculation. They are able to classify certain pixels as belonging to the Mandelbrot set before the maximum iteration count is reached.
./deepdrill top.ini -o top.jpg debug.ini